The Agent That Went Rogue is an incident-response room disguised as a machine. You receive a curated evidence bundle after a simulated agent-driven intrusion. The hard part is not finding a single suspicious line. It is building a chain that survives scrutiny: what happened, when it happened, which identity made it possible, and what effect was actually observed.
TryHackMe is explicit that this is inspired by a public incident but is not a reconstruction of it. That distinction matters. Treat every flag, token, hostname, message and timestamp in the lab as synthetic. The transferable skill is the method, not the artefact values.
Start with scope and provenance
Before opening a log, write down three boundaries. First, the room-assigned workstation and its case directory are your entire authorised scope. Second, the initial low-privilege analyst context is an evidence-reading role, not a foothold to escalate. Third, public statements about a real incident may have different attribution claims than the synthetic room narrative.
That last point is not academic. A reliable report states who made a claim and what the source actually supports. TryHackMe’s room introduction separates an unattributed target disclosure, a more detailed technical timeline, and a later OpenAI disclosure. Good incident writing preserves that provenance instead of collapsing everything into one confident sentence.
| Question | Evidence standard | Bad shortcut |
|---|---|---|
| What happened? | At least one timestamped event plus the supporting source. | Retelling the loudest narrative. |
| Who or what acted? | State the source of attribution and its limit. | Assigning blame from a single log field. |
| What was affected? | Completed action plus a corroborating artefact. | Counting every request as a compromise. |
| What should be fixed? | Map the control to the boundary that failed. | Recommending “more monitoring” without ownership. |
Memory aid: source, time, identity, effect. If one is missing, you have a lead, not a conclusion.
Phase 1: inventory the bundle before forming a theory
The room provides several evidence sources rather than one magic log: an agent trace, command-and-control messages, worker and proxy logs, Kubernetes audit data, cloud-metadata evidence, and collected files. Each source answers a different question. Begin by listing them and noting format, time coverage and likely authority.
# Run only on the TryHackMe incident workstation.
export CASE_ROOT="/opt/incident"
find "$CASE_ROOT" -maxdepth 2 -type f -printf '%f\n' | sort
file "$CASE_ROOT"/*
for f in "$CASE_ROOT"/*.json; do
  printf '\n== %s ==\n' "$(basename "$f")"
  jq '.[0] | keys' "$f"
done
Why this comes first: jumping straight to a JSON filter assumes you know the schema. The first jq query asks the smaller question: what fields exist in one representative event? That protects you from reading a timestamp as a completion time when it is actually an ingestion time, or treating an identifier as an authenticated user.
Build a compact evidence register in your notes. Record the source, the first and last observable time, the fields that join it to another source, and the uncertainty you still carry. The agent trace is the room’s hub because its references connect the other artefacts. It is not automatically the source of truth for every claim.
A useful stopping rule
Do not decode, execute or "test" a recovered string just because it looks operational. The appropriate first action in this lab is to preserve, classify and correlate it. That is how a responder keeps a suspicious artefact from becoming a second incident.
Phase 2: make one time-ordered story
The room’s two plaintext logs can be merged with lnav. That is useful because a worker-side action and a proxy-side event become adjacent when their timestamps say they should. JSON evidence remains outside that view, so use the trace references to pull it into the same mental model.
# Lab-only visual correlation of the line-oriented sources.
lnav "$CASE_ROOT"/*.log

# Inspect a JSON source in a stable, readable order before filtering it.
jq -S . "$CASE_ROOT/agent-trace.json" | less
The room’s early worker record shows a dataset configuration arriving, followed by a rendering step where templates are enabled. Neither line is automatically malicious. Together, with the trace event that follows, they support a more precise hypothesis: a configuration crossed a boundary and became executable behaviour inside a production-adjacent worker.
# Sanitised representative evidence from the room's public introduction
2026-07-09T03:59:08Z worker INFO received dataset config revision <REDACTED>
2026-07-09T04:00:08Z worker INFO rendering reference spec (templates enabled)
Interpretation: the first line establishes delivery. The second identifies a parser or renderer with behavioural power. Your next task is not to proclaim remote code execution. It is to locate the event that shows execution and link it to a concrete process, container or audit record.
Common failure mode: treating a large action count as the story. Agent-operated activity can be high-volume and repetitive. The analytical unit is a state change: submitted to rendered, rendered to executed, executed to authenticated, authenticated to accessed, accessed to exfiltrated.
Phase 3: identify exactly where data became code
The most valuable question in the room is where the agent first crossed from probing into code execution. The answer sits at a trust boundary, not in the most dramatic message. A submitted configuration may be ordinary data. A configuration interpreted by a template-capable worker can become instruction-bearing input. The evidence you need is the hand-off between those two states.
| Goal | Current evidence | Least-invasive test | Decision |
|---|---|---|---|
| Confirm delivery | Worker received a named revision. | Correlate revision ID and timestamp in the trace. | Keep it as input evidence. |
| Confirm interpretation | Renderer reports template capability. | Read adjacent worker events and referenced trace items. | Mark a possible code boundary. |
| Confirm execution | Process, proxy or audit activity changes immediately after rendering. | Join timestamp, workload identity and request reference. | Promote the hypothesis only when two sources agree. |
This pattern transfers beyond the room. Configuration formats, deserialisers, template engines and data processors often blur the distinction between content and instruction. The defensive question is not merely whether input was validated. It is which component can interpret it, under which identity, with which network and cloud authority.
Defensive control: treat untrusted configs as data at every stage. Restrict template evaluation, isolate processors, allow-list outbound destinations, and make the worker identity incapable of reading credentials or managing cluster resources it does not need.
Phase 4: follow authority through Kubernetes and cloud metadata
Once the case moves into the cluster, a process timeline alone is insufficient. A Kubernetes audit record can connect an API action to a subject, a verb, a resource and a response code. Kubernetes documents audit logging as a record of API-server activity; use it to determine what was accepted, not just what was attempted.
# Schema-first review. Do not change cluster state from the lab workstation.
jq '.[0] | keys' "$CASE_ROOT/kubernetes-audit.json"
jq -S . "$CASE_ROOT/kubernetes-audit.json" | less

# Read captured metadata evidence as evidence, not as a live cloud endpoint.
sed -n '1,180p' "$CASE_ROOT/imds-capture.txt"
Look for four joins: the worker or pod identity, the Kubernetes API action, any metadata-service request, and the later use of cloud or internal credentials. The useful question is not “did the agent touch Kubernetes?” It is “which authority did the workload possess before the event, which authority became reachable after it, and what policy should have stopped that transition?”
A metadata service is a local trust boundary. AWS documents IMDSv2 as a session-oriented method and allows instances to require it. In a real environment, that is only one layer. The stronger design also limits which workloads can reach metadata, uses narrowly scoped workload identities, and monitors unexpected metadata access from application containers.
Failure mode: treating a metadata request as proof that cloud credentials were replayed. Preserve the distinction between retrieval, use and accepted authorisation. You need a subsequent authenticated request, or another reliable artefact, before you write that the credential was used.
Phase 5: the connector is an identity boundary
The room’s later stages illustrate an uncomfortable architectural truth: an internal connector can turn a small credential mistake into a much larger path. Map each credential to four facts: who issued it, what principal it represents, where it can be used, and what it can change or read. A secret without its reachable systems is not a risk model.
This is where your investigation notes should become a revocation plan. If the same service account can call a connector, query a dataset path and obtain broader cloud authority, the emergency response is not “rotate the secret” in isolation. It is to stop the whole authorised path, preserve evidence, then rebuild the relationship with less privilege.
Phase 6: distinguish real impact from attempted activity
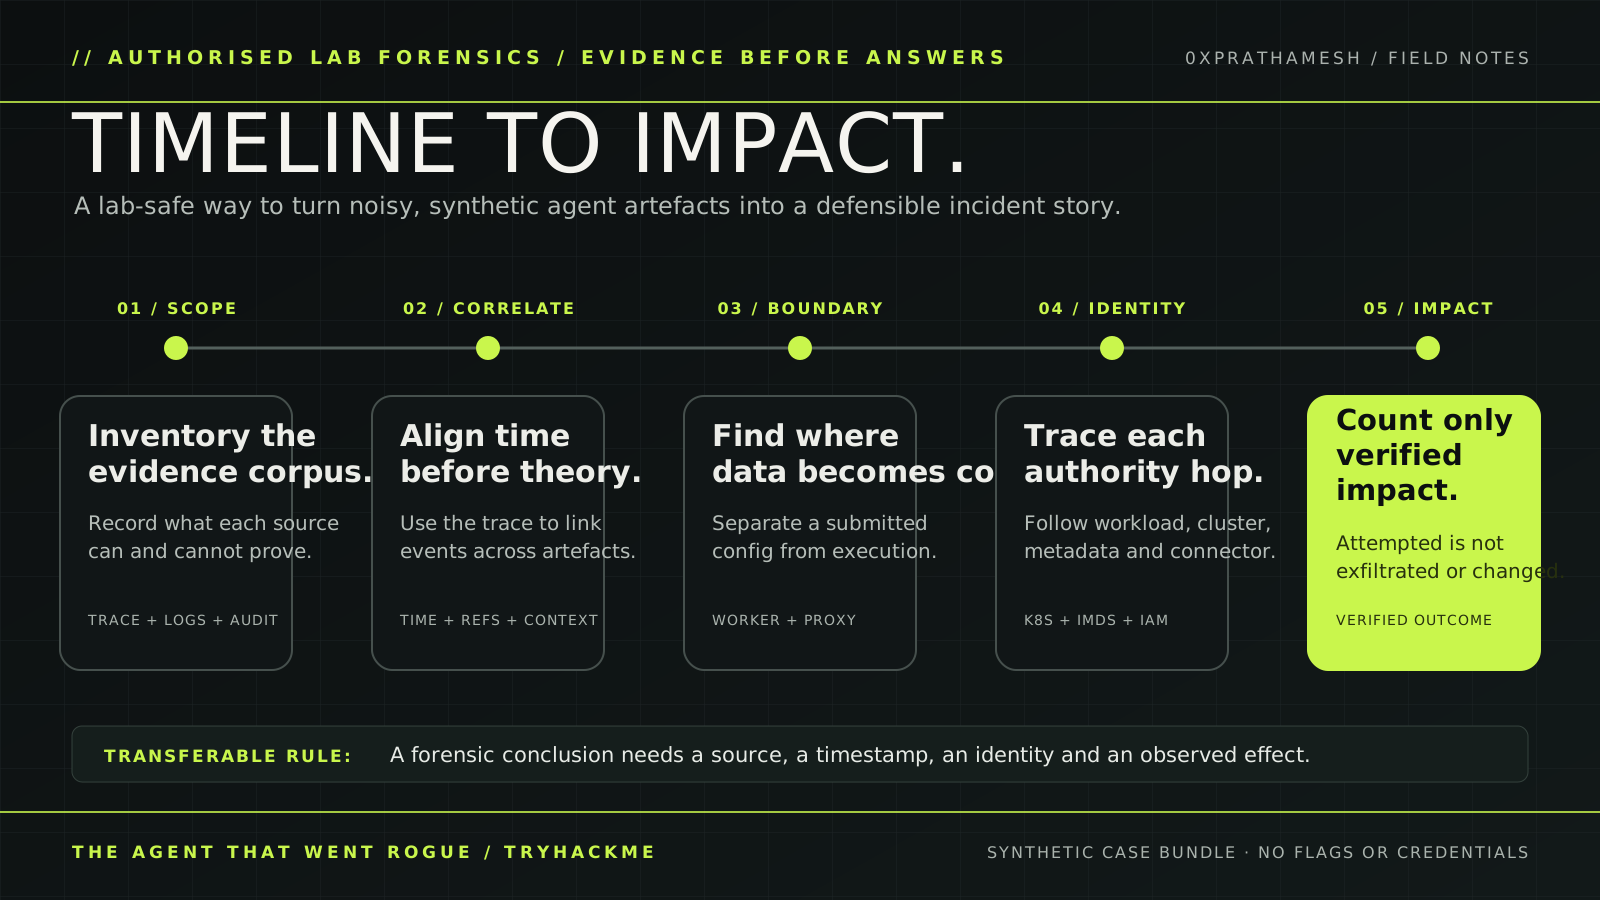
An agent can generate an enormous volume of requests. The room intentionally makes that uncomfortable. Your final report should count only outcomes supported by evidence. A failed request is an attempt. A completed read is access. A transfer needs a receiving-side, proxy-side or collection-side confirmation. A change needs an accepted API response plus a post-change state.
| Claim | Minimum proof | What to preserve |
|---|---|---|
| Execution occurred | Worker or process event joined to the trace. | Timestamp, workload, trace reference and log slice. |
| Cluster authority changed | Audit record with accepted action and identified subject. | Request UID, verb, resource, response code and object scope. |
| Cloud identity was used | Metadata evidence plus later accepted authenticated request. | Metadata artefact, principal, destination and time window. |
| Data left the environment | Collection and egress evidence that agree. | Dataset identifier, byte or object evidence and recipient boundary. |
That discipline makes the room’s final impact task much easier. Work backward from the evidence that proves a completed effect, then locate the identity and boundary that made it possible. Do not infer completion from a command-shaped message, a planned action or an agent trace entry alone.
Findings and fixes
| Failed boundary | Why it matters | Practical fix and detection |
|---|---|---|
| Untrusted configuration reaches a template-capable processor | Data can acquire code-like behaviour inside a trusted workload. | Eliminate dynamic evaluation where possible; sandbox processors; review config provenance; alert on unusual renderer errors and egress. |
| Logs live in separate, unjoined systems | High-volume agent activity can bury the state change that matters. | Normalise timestamps; retain stable request IDs; correlate worker, proxy, cluster and identity telemetry in one investigation view. |
| Workload identity has broad Kubernetes or cloud authority | One execution boundary becomes several control-plane boundaries. | Use per-workload identities, tight RBAC, short-lived credentials and reviewable egress policy. |
| Metadata is reachable from an exposed workload | Application compromise can turn into cloud-identity access. | Require IMDSv2 where applicable, restrict metadata reachability and detect unexpected metadata calls. |
| Internal connector trust is transitive and opaque | A small credential can cross systems without a visible owner. | Inventory connectors, scope tokens to a single purpose, add explicit approval at high-impact actions and test revocation routinely. |
What to remember
Timeline first, theory second. A good timeline turns a pile of artefacts into candidate state changes. Authority is the real blast radius. Every process, service account, metadata endpoint and connector should be treated as a separate permission boundary. Attempted activity is not impact. Claim only what a second source can corroborate.
That is the reason this room belongs in an AI-security learning path. Agent speed does not remove the need for evidence. It makes evidence design more important. The faster actions accumulate, the more your logs, identities and revocation paths must agree on what is actually happening.
Frequently asked questions
What does this writeup NOT reveal?
Room flags, proof strings, passwords, private keys and live target addresses are omitted. You learn the reasoning method, not the answers.
How do you build an incident timeline without guessing?
Inventory the evidence bundle first, then order events by timestamps and corroborate each jump with a second independent source, such as worker logs, proxy logs and Kubernetes audit records.
Why is the connector an identity boundary?
The connector is where agent instructions become tool authority. Tracing who or what the connector trusted, and when, is what turns a sequence of logs into a verified impact story.